Description
Terms | Tools | Techniques
#
1 Sample Sign Test: use to estimate the population median and compare it to a target or reference value; it tests the probability of a sample median to be equal to the hypothesized value: Ho: m1=m2=m3=m4 (null hypothesis), Ha: 1+ is different (alternate hypothesis). See also Lean6 toolkit.
2 Sample t Test: tests the hypothesis that the means of two samples are being equal. See also Lean6 toolkit.
3P Model of TQM: focuses on three pillars to raise the quality level: (1) People: satisfying internal and external customers, the employees and consumers; (2) Product: meeting specifications and expectations; (3) Process: must be capable and continuously improving.
3D – Dirt, Danger, Defect: causes malfunction in a product or system or deviations from the acceptable standard.
3L – 3 Losses: (1) waste, (2) strain, (3) variability; they are called “3M” in Japan.
3M – Muda, Muri, Mura: the Japanese terms for waste, strain and variability, equivalent to the 3L.
4M/6M/10M Fishbone Categories: (1) Man, people; (2) Machine; (3) Material; (4) Method; (5) Management; (6) Milieu or environment; (7) Metrics; (8) Mindpower; (9) Money; (10) Miscellaneous.
5S: Process and system to achieve and maintain a safe, clean, and efficient work place: (1) Sort/Seiri: put things in order and remove what is not required; (2) Straighten/Seiton: arrange systematically so things can be found when needed; (3) Shine/Seiso: clean up from floor to ceiling, remove dirt and dust, and fix or replace broken items; (4) Standardize/Seiketsu: mark locations, attach labels, install signs, implement checklists and procedures; (5) Sustain/Shitsuke: teach people and make them commit to the process, audit regularly, guide and give feedback. See also Translean toolkit and Lean Audit.
5 Laws of Lean Six Sigma: (1) Law of the Market: Critical To Customer CTC requirements define quality and are the highest priority for improvement, followed by Return On Invested Capital ROIC and Net Present Value NPV; (2) Law of Flexibility: velocity is proportional to the flexibility of the process; (3) Law of Focus: according to the Pareto Principle, 20% activities cause 80% of delays and defects; (4) Law of Velocity or Little’s Law: velocity is inversely proportional to amount of Work In Process WIP. (5) Low of Complexity: complexity wastes more money than poor quality and low speed.
5W – 5Why: identifying the root-cause by asking “why” five times.
5W+1H: key elements to design effective standards: What, Who, When, Where, Why, and How to accomplish work.
5Z: Japanese method to promote, maintain, and improve process control by defining what Not (Zu) to do: (1) UketoraZu: don’t accept defects; (2) TsukuraZu: don’t create defects; (3) BaratsukasaZu: don’t create variations; (4) KurikaesaZu: don’t repeat mistakes; (5) NagasaZu: don’t supply defects.
6BL – The Six Big Losses: causing poor equipment performance: (1) Failures: downtime from equipment failures and repairs; (2) Setups: changeovers and adjustments; (3) Halts: minor stops below one minute; (4) Slowness: speed losses from processing low-grade material; (5) Scrap: non-conforming parts that cannot be repaired; (6) Rework: items processed more than once. See also Total Productive Maintenance TPM.
6W Planning: describes the key elements of any effective plan or procedure: (1) What to do, the observation; (2) Why to do it, the reason; (3) Where to do it, the location; (4) Who to do it, the owner; (5) When to do, the start time and duration; (6) Which details to consider, the requirements, conditions, limits, and expected results.
7QT – The Seven Quality Tools: (1) Run chart; (2) Histograms; (3) Fishbone diagram; (4) Check sheet; (5) Pareto chart; (6) Control chart; (7) Scatter plot.
8D Problem Solving Process: defined by Henry Ford are (D1) Describe the problem; (D2) Establish a team and assign responsibilities; (D3) Develop an interim containment action; (D4) Identify and verify root causes; (D5) Select corrective actions; (D6) Implement and validate corrective actions; (D7) Prevent recurrence; (D8) Communicate the result and recognize the team.
7W – 7 Wastes: originally identified by Taiichi Ohno from Toyota; the key concept of Lean Thinking: (1) Specify value-add VA from the standpoint of the end customer by product family; (2) Identify all steps in the value stream, eliminating those that do not create value; (3) Arrange VA-steps in tight sequence so value flows smoothly toward the customer; (4) As flow is introduced, let customers pull value from the next upstream activity; (5) Repeat this process until a state of perfection is reached, waste is eliminated.
8W – 8 Wastes: consume resources in excess of what is required to satisfy customer requirements; they can be easily remembered as DOWNTIME: Defects, Overprocessing, Waiting, Non-utilized talent, Transportation, Inventory, Motion, Extra processing. Another acronym is TIM WOODS: Transportation: moving parts, people, information; (I) Inventory: work in process, parts, supplies, pending decisions, documents; Motion: reaching, bending, stretching, lifting; Waiting: for parts, decisions, resources, information; Overproduction: producing too many or too early; Overprocessing: excessively precise, producing higher quality than required, adding features that nobody asked for; Defects: unclear instructions or faulty parts causing returns, rework, repair, scrap; waisted Skills: untrained people, underutilized capabilities, unrecognized talents of people. See also Translean toolkit and Lean Audit.
14 Obligations for Top Management by Deming: (1) Create constancy of purpose for continual improvement; (2) Adopt the new philosophy; (3) Cease dependence on mass inspection to achieve quality; (4) End the practice of awarding business on price tag alone; (5) Constantly and forever improve all systems and activities; (6) Institute modern methods of training on the job; (7) Institute positive approach to supervision and leadership; (8) Drive out fear; (9) Break down barriers between departments; (10) Eliminate numerical goals (quotas) for the work force; (11) Eliminate work standards that prescribe quotas alone; (12) Remove barriers that impede pride of workmanship; (13) Institute a vigorous program of training for everyone; (14) Create a structure to push the above 13 points.
A
ABC – Activity Based Costing: accounting method that focuses on assigning cost to activity rather than to functional units, such as departments and work-centers. ABC delivers better data for managers than traditional cost accounting by identifying major activities and classifying them into four categories: (1) Unit; (2) Batch; (3) Product; (4) Facility. Costs in categories 1-3 are directly assigned to products using cost drivers. Facility-based activities are treated as period costs and allocated to products using an allocation key.
Abnormality Management: ability to see and respond to an abnormality, any violation of standard operations, in a timely manner.
Absorption Costing: for companies offering a variety of products or services, absorption costing provides a quick and easy way to spread overhead evenly across the different areas. A single absorption rate allocates overhead as a percentage of direct labor hours, work orders, material amount, or machine hours. In this scenario, with all products being treated equally, products with high margins subsidize less profitable products. This makes absorption costing simple but not very accurate for larger or more complex organizations due to the reduced visibility on subsidies.
Acceptance Number: highest number of defectives in a sample that still permits to accept the lot per AQL method.
Accessory Planning: planned utilization of remnant material (leftovers) for value-added purposes.
Accountability: conditional personal and professional liability by action or responsibility, assuming: (1) Willingness to be held accountable; (2) Possessing adequate expertise; (3) Being capable of performing the job.
Accountable: willingness to explain the difference between the target and the current condition.
Accounts Payable: amounts owed to suppliers of goods or services; liabilities from a purchase.
Accuracy: difference between data average and the target, aiming right but might still have large spread. Accuracy is different from precision, which measures the tightness of the cluster. When all data are close together (precision), then precision can be improved by adjusting the offset.
ADN – Anderson-Darling Normality Test: statistical test of whether a given sample of data is drawn from a given probability distribution.
Affinity Diagram: tool to sort and present many data (ideas, problems, solutions) in logical categories. Example: collect ideas on post-it notes during a brainstorming session and group them by topic, such as Fishbone categories.
AIQ – Average Incoming Quality: the quality level going into the inspection point.
Alias: lost interactions in a Design of Experiment DOE when two or more parameters have been changed at the same time in the same way. Aliasing is a critical feature of Plackett-Burman, Taguchi designs or standard fractional factorials. For Aliasing see also Confounding.
Alpha Risk: rejecting good parts is called type-I error or producer’s risk.
Alternative Hypothesis (Ha): statement that samples are not equal, while the hypothesis (Ho) says that they are equal.
ANOVA – Analysis of Variance: a statistical method to test for a difference between two or more means by comparing the variances within and between groups. ANOVA is a calculation procedure to allocate process variation and determine if it is (a) significant or (b) caused by random noise. A balanced ANOVA has equal numbers of measurements in each group or column. In a stacked ANOVA, each factor and response have data in only one column. See also Lean6 toolkit.
Andon: Japanese term for paper lantern; a signaling device to indicate problems or resource shortages. Example: flag, traffic light, status signal.
AOQ – Average Outgoing Quality: quality level leaving the inspection point after removing or rectifying defects. Without quality control, AOQ = AIQ.
Appraisal Cost: cost for preventing defects, such as training, developing manuals, audits.
APQP – Advanced Product Quality Planning: for more details, download the Lean Six Sigma Lexicon – it’s free!
AQL – Acceptable Quality Level or Assured Quality Level: the max number of defects in a sample that makes the lot still acceptable. Problem with AQL is that a “good” lot may still contain many bad items. The zero defect approach is the only true AQL. See also Reject Quality Level RQL.
ARMI – Approver, Resource, Member, Interested Party: for more details, download the Lean Six Sigma Lexicon – it’s free!
Arrow Diagrams: tool used to define optimal schedules by identifying relationships between tasks to implement a plan. Nodes = events. Arrows = Activities. Used in Program Evaluation and Review Technique PERT and Critical Path Method CPM.
Artisan Process: pioneering effort to invent something new. See Project, Operations, Automated Process.
A-Square: test statistic for ADN that measures how closely a dataset follows the normal distribution. Ho = normal. Only for large A-squared, small p-value, reject the null hypothesis because distribution is not normal.
Asset Waste: adding assets without considering workflow and traffic patterns; principles are (a) every wall stops flow, (b) each process out-of-sight adds cost for extra motion, coordination, and internal transportation, and (c) all empty spaces fill up over time.
Assurance: confidence in establishing and maintaining processes, skills, and systems to meet targets.
Attribute Data: binary or qualitative data from items that can only be counted but not analyzed, such as good-bad or yes-no.
Audit: process or system of inspection to ensure that specifications conform to documented standards. See also Lean Audit book and system
Authority: granting or taking power and liability to make a decision on the behalf of others.
Autocorrelation: serial correlation or cross-autocorrelation is the cross-correlation of a signal with itself at different points in time; it is a mathematical tool for finding repeating patterns, such as the presence of a period signal obscured by noise.
Automated Process: replacing labor content by machines and systems in an attempt to improve efficiency.
Autonomation: equivalent of the Japanese term Jidoka, which means “automation with human intelligence” by adding sensors and algorithms to machines so they stop automatically when abnormalities are detected, preventing reproducing defects. Poka Yoke, the mistake-proofing techniques are integral part of Jidoka.
Autonomous Maintenance: process to eliminate the three evils of equipment failure (1) improper cleaning, (2) improper lubrication, and (3) improper use by doing the four key activities of autonomous maintenance (1) daily cleaning and inspecting to identify abnormalities, (2) scheduled lubrication to reduce friction and vibration, (3) adherence to standards to ensure correct operation and eliminate misuse, (4) completion of checklist tasks such as tightening, adjusting, and replacing worn parts.
Availability: a person or process is ready to perform satisfactorily when needed. See also Overall Process Efficiency OPE and Overall Equipment Efficiency OEE.
B
B10 Life: time by which 10% of the product population, of which all units are shipped and in the field, will get failed.
Backdate: start and finish dates for each operation calculated back from the shipping or completion date.
Balanced Experiments: when all factor levels or treatment groups have the same number of units. Balance is nonessential but desirable to reduce complexity. Imbalance is acceptable for low significance factors.
Balanced Production: level of production where capacity is perfectly balanced to market demand. See also Heijunka. See also Translean toolkit.
Balanced Scorecard BSC: management tool to drive performance and accountability throughout the organization; it typically measures (a) financial performance, (b) operational performance, (c) employee engagement, and (d) customer satisfaction.
Bar Chart: graphical translation of values into length of bars.
Barlett Test: for ANOVA to determine if there is a difference in variance between 3+ samples or groups.
Baseline: snapshot of inputs and outputs at a specific time, used as a reference to measure improvement.
Baselining: assessing process performance against an internal reference that represents the “normal” condition.
Benchmarking: measuring performance against a reference, the best performance (a) within the company, (b) industry, or (c) physical limit.
Best Practices: best method for accomplishing a result. See also Lean Audit.
Beta Risk: risk of accepting and shipping bad parts, also called type-II error or consumer’s risk. Example: at 0.10 probability, the risk of making the wrong decision is 10% might be tolerable for filling water-bottles, but is not good enough for testing pace-makers or airbag-controllers.
Bias: difference between the observed mean (sample-average) and real or reference value (population-mean).
Bimodal Distribution: two values occur more frequently in data set than rest of the values “camel curve”.
Binomial Distribution: trial where only two outcomes are possible, such as success-failure: x=successes in n=trials with p=probability of success in single trials.
Black Belt: group leader responsible for implementing a Six Sigma or Lean initiative across the value stream to improve quality, productivity, and customer satisfaction. for more details, download the Lean Six Sigma Lexicon – it’s free!
Black Noise: non-random sources of variation or special cause variation.
Blocking: neutralizing an uncontrollable background factor which cannot be eliminated through randomizing by spreading them across the experiment in a controlled way.
BOA – Bill Of Activities: structured listing of the sequence of activities performed to product a unit of product or service; the BOA covers direct and indirect labor activities, such as design, sourcing, controlling.
BOM – Bill Of Materials: structured list of parts and components required to build a product.
Bottleneck: any resource that constraints output below demand, such as limitation in time, money, labor, equipment etc. See also Theory of Constraints TOC.
Box-Cox Transformation: used for converting data to a normal distribution to determine process capability.
Box Plot: box-and-whisker diagram showing centering, spread, and distribution of a continuous data set with the following five criteria: (1) the box represents 50% of the data; (2) the median is the point where 50% of the data is above and 50% is below it, or left and right depending on orientation; (3) the 25th quartile is where max 25% data fall below it; (4) the 75th quartile is where max 25% data are above it; (5) whiskers cannot extend more than 1.5x the length of the inner quartiles, any data points outside are outliers.
BPM – Business Process Management: improving corporate performance by managing and optimizing a company’s business processes on a macro and micro level. BPM assigns ownership, cycle times, job description, and success measures across multiple applications, functions, and locations.
BPMS – Business Process Management System: for more details, download the Lean Six Sigma Lexicon – it’s free!
Brainstorming: method to generate ideas and solve problems. Rules: (a) No evaluation as there are no bad ideas; (b) All voices will be heard; (c) Vote to identify best ideas; (d) Build on best ideas.
BRM – Business Risk Management: process to evaluate business risk and make decisions to mitigate or control those risks.
Buffer: storage location that contains semi-finished goods to smoothen demand variations (Mura) and ensures continuous flow. Buffer-size is calculated based on lead time (time to replenish) and takt-time (pace of customer demand).
Bullwhip Effect: refers to demand amplification, when orders move upstream from customer to supplier, the demand pattern becomes increasingly erratic since demand variability is amplified at each step. The Bullwhip Effect is driven by the number of work centers, the cumulative lead time, and the human preference of holding additional parts “just in case” (JIC) to be “better safe than sorry”.
Business Metrics: high level management performance indicators, such as sales, profitability, inventory, fulfillment, delivery, etc.
BVA – Business Value Add: step required by the business but not noticed by the final customer, also called Muda type-1 or “required waste”. Example: quality checking, time recording, performance reporting.
C
Calibration: adjusting a measurement device to a standard of known accuracy to minimize errors.
CAP – Change Acceleration Process: for more details, download the Lean Six Sigma Lexicon – it’s free!
CAPA – Corrective And Preventive Action: three-step process to rectify a problem: (1) Correction: quick fix, Band-Aid, immediate containment to stop the problem from spreading; (2) Correction: permanent solution to eliminate the root-cause of non-conformity and prevent recurrence; (3) Prevention: permanent change to eliminate the cause of potential non-conformity.
Capability: ability of a person or process to perform according expectations to satisfy requirements.
Capacity: maximum throughput, ability, speed, and volume constrained by the bottleneck. Example: output rate, skill, engine performance, size of a container. For a process: Capacity = 1/CycleTime.
CAR – Corrective Action Report: used in response to a defect in three steps: (1) Reporting on a detected non-conformance; (2) Root cause analysis; (3) Action to prevent the defect from reoccurring.
Cause: any input (factor X) that impacts a result (response variable Y). Example of cause: source of variation in a process that adversely a Key Performance Indicator KPI
Cause & Effect Diagram: visual tool to organize causes or opportunities to solve a problem or achieve a specific target. See also Lean6.
CCR – Capacity Constraint Resource: weakest link in a chain, such as the slowest machine in a line (highest cycle time). See also Theory of Constraints (TOC).
Cell – Cellular Manufacturing: people, machines and stores arranged in close proximity to each other and in sequence of the actual process. Purpose is to minimize lot sizes by creating flow and move parts quickly in very small batches – ideally, one at a time (single-piece-flow). Typical cellular designs are in U, L, T, H shape where operators remain inside the cell and material is fed from the outside to minimize operator movement and maximize flow efficiency.
Center: average value of a set of data. See also Mean.
Central Limit Theorem: states that with increasing sample size, a sampling distribution of the mean approaches the normal distribution as variance decreases (variance/n) by increasing sample-size (n). See also Lean6 toolkit.
Central Tendency: indication of the location, indicating how central data are, measured by three elements: (1) Mean: numerical average; (2) Median: midpoint of a data set where half of the points are above and below the median point; (3) Mode: value that occurs most frequently.
Chaku-Chaku: Japanese term for “load-load” when machines eject parts automatically so that an operator can focus on loading several machines in sequence instead of attending just one machine doing loading and unloading.
Champion: senior executive giving advice to the implementation team, steering activities, and allocating ensuring resources are available to meet team objectives.
Change Agent: person who implements change with the mission to lead from the current state to the future state. Change agents lead Six Sigma and Lean transformations. For them, superior project management and people skills are important to succeed.
Change Management: process to control the implementation of agreed changes.
Change Team: group of 2-10 people implementing continuous or step improvements (Kaizen or Kaikaku), reporting weekly to the Executive Steering Committee (ESC).
Characteristic: measurable feature of any variable, process, product, system.
Charter: document specifying scope, purpose, critical success factors, activities, team, sponsors, metrics, and timeline of an improvement project – defined by the Change Agent or Executive Steering Committee (ESC). See also Lean6 and Translean toolkits.
Chi Square Test: statistical test, most popular hypothesis testing method for discrete data that assesses (1) Goodness of fit: if the sample was drawn from a population with specific distribution; (2) Test for homogeneity: if several populations are homogeneous to a specific characteristic; (3) Test of independence: if the null hypothesis is valid; if two criteria are independent then there is no association. See also Lean6 toolkit.
CI – Continuous Improvement: improving effectiveness by reducing the three losses: (1) Waste, (2) Strain, (3) Variability. See also 3L and 3M.
Circumstance: sum of essential facts conditioning or determining the probability of an event.
Cmk – Machine Capability Index: target > 2.00 for a good process. Short-term capability, calculated using continuous samples.
COC – Cost Of Conformance: total cost for ensuring that a product is conforming. COC covers testing, training, inspection, prevention.
Coefficient of Variation: relative measure of dispersion by expressing the standard deviation as a percentage of the mean.
COGS – Cost Of Goods Sold: cost of goods available − cost of ending inventory. Cost of goods available = cost of beginning inventory + purchases + cost of production.
Common Cause: source of random variation, such as noise, inherent in the process itself.
Confidence Band or Interval: measurement of certainty that the true regression line fits within the confidence bands. Example: an estimated defect in a population is 10% at 95% Confidence and +/-2% Confidence Interval; it means that the true population parameter is 8%…12% with 95% certainty.
Confirmation: most critical step of a Design Of Experiment DOE is getting confirmation that process settings deliver calculated results. If an (uncontrolled) interaction is present, confirmation is generally not possible.
Confounding: interaction effects are confounded when the effects of multiple factors on a response cannot be separated.
Consequential Metric: measures negative side effects as a result of improving the primary metric. Same as Secondary Metric.
Consumer Risk: concluding that an item is good (passed) when it is actually bad (fail) is called type-II error.
Constraint: any obstacle that limits throughput, the weakest link in a chain. See also Theory of Constraints TOC.
Containment: systematic search and quarantine of nonconforming products and materials.
Continuous Data: information measured on a continuum or scale; any numeric value is possible.
Continuous Flow: when items are processed in sequence, moved directly from step to step without waiting in between. The rate of production (the supply) must be perfectly in sync with the demand of the next process to achieve flow, following the “make one, move one” philosophy.
Continuous Improvement: see also CI and Translean toolkit.
Control: absence of erratic (non-random, special cause) variation, when only noise (random, common cause) is present.
Control Chart: graphical representation of changes to monitor a process and track performance (typically over time).
Control Limits: area defined as +/- 3 standard deviations from the mean or centerline. See also Lean6 toolkit.
Control Plan: defines process variables, sampling, validation to ensure capability of a process.
Conversion: translate capability into sigma level and defect rate: Cpk = z (short-term) = Z (long term) +1.5 = SigmaLevel/3. Start with Defects Per Million Opportunities DPMO/1,000,000 and read z (short-term) from the table of standard normal curve and convert into Sigma level. See also Lean6 toolkit.
CONC – Cost Of Non-Conformance: the total cost of failures including rework, scrap, lost items, legal issues, warranty claims, returns, failure analysis etc.
Conditional Maintenance: enhances scheduled maintenance with sensory information that provides an alert when maintenance is required. Example: using telemetry to send data about acceleration, vibration, sound levels, and in-line gauging to determine the optimal time to replace parts.
COPQ – Cost Of Poor Quality: cost as a result from producing defects, excluding the Cost Of Conformance COC for detection and prevention but includes CONC plus opportunity cost from missed sales as resources are used to rectify the problem: (1) Cost for rectification = labor + material + utilities; (2) Lost revenue and margin, today’s profits; (3) Lost opportunity, customer-value and market-share, future profits. COPQ is also called Non-Quality Cost, NQC. See also Lean6 toolkit.
COQ – Cost Of Quality: money lost from a product or service that was not right first time = COC + CONC.
COPIS – Customer-Output-Process-Input-Supplier: reverse of SIPOC used to analyze a business from outside-in, from the customer back through the process to the inputs and resources.
Correlation: action to rectify a known nonconformance = corrective action + preventive action.
Corrective Action: prevents the recurrence of a defined nonconformance by eliminating its cause.
Corrective Maintenance: trouble shooting, repairing after an anomaly has been detected to restore normal operating conditions. It is based on the belief that the cost of downtime plus repair is lower than the investment required for a maintenance program.
Correlation: technique to identify the relationship between two continuous variables. Example: increasing temperature makes rubber soft, so softness is positively correlated to temperature.
Correlation Coefficient (r): quantifies the degree of linear association between two variables (r=-1…+1). Correlation: r=70% means that 70% of the output variable can be explained by the input variable. See also R-Squared.
Covariates: uncontrolled, random variables (noise) treated as concomitants (something that influences the result) but do not interact with any of the key parameters (factors) being tested.
CP – Process Capability (Cp): without centering, index that measures the ability of a process to produce consistent results; it is the ratio between required and actual variability. Required range = specified range = tolerance = permissible spread = difference between upper and lower specification limit. Actual spread = 3 standard deviations, arbitrarily defined as 3Z = 99.7% of all values. Cp = (USL-LSL)/6 Sigma. Note: Cp does not consider how well the process is centered (see Cpk).
CPK – Process Capability (Cpk): with centering, index similar to Cp but considers how well a process is centered; it is ratio between permissible variability and actual variability, measured from the mean value to the nearest specification limit. Cpk = Min [(USL-Mean)/(3Sigma), (Mean-LSL)/(3Sigma)]. Desired: Cpk > 1.33 (4/3). Imagine: 4 standard deviations are small enough to fit in a half specification tolerance.
CTQ – Critical To Quality: customer needs translated into measurable characteristics that need to be controlled to satisfy customers.
CTC – Critical To Customer: input parameter to the Quality Function Deployment QFD matrix to analyze customer needs and created best value by optimizing the cost-performance or value-for-money ratio. Example: readable display in bright sunlight, good grip when wet, easy to handle, 3-step process etc.
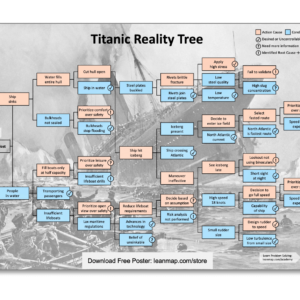
CRT – Current Reality Tree: tool to identify the relationships between current undesirable effects causing most of today’s problems; those UDEs are subject to problem solving.
Customer: person who receives product or service and evaluates it against needs.
Customer Focus: putting the customer at the center of all attention and as a reference for all activities. See also Voice of the Customer VOC.
Cusum Chart: control chart based on cumulative sum to detect small changes <0.5 sigma; mainly used in biology and by the Pharma industry.
Cycle Time (CT): total time it takes for a process to complete all steps before it repeats = process-time + move-time + waiting. For the man-machine interface it is important to distinguish between Operator Cycle Time (OCT) and Machine Cycle Time (MCT) to maximize efficiency. Total Cycle Time TCT = CT + setup-time/batch-size. See also Translean toolkit.
D
Dashboard: tool to display and monitor business metrics, such as cost, quality, delivery, efficiency.
Data: information used as basis for discussion, reasoning and analysis; singular form is “datum”.
Datsu Chaku: the Japanese term for “unload-load” used in manufacturing to prepare and unload a machine after processing. See also Chaku Chaku (load-load).
Defect: undesired result caused by 10 sources: (1) omitted processing, (2) processing error, (3) item incorrectly setup, (4) missing item, (5) wrong item, (6) processing the wrong item, (7) adjustment error, (8) miss-operation, (9) equipment setup incorrectly, (10) tools and jigs improperly prepared. See also Lean6 and Translean toolkits.
Defect%: ratio of defectives to total unit count, opposite of yield. Example: 3% defectives = 97% yield.
DOF – Degrees of Freedom: is the “currency of statistics” as every additional data point increases or earns DOF-points, while every estimated parameter reduces DOF-points. DOF = (#Rows-1) * (#Columns-1).
DFMA – Design For Manufacturing and Assembly: tool to improve manufacturability by (1) assessing repeatability and reproducibility and then (2) optimizing and simplifying the design to reduce time and cost.
DFMEA – Design Failure Mode And Effect Analysis: model applied to the design process. See also FMEA.
Directive: elements that guide people and actions towards a goal. For more details, download the Lean Six Sigma Lexicon – it’s free!
Discrete Data: information categorized into a classification and based on counts. Example: units passed, population of a city, number of light bulbs in a building.
Direct Costing: simplest costing method that assigns variable costs (parts and labor) directly to products and services; it is appropriate for simple operations and small businesses with low overhead, like a doctor’s office or a coffee shop. Direct costing considers fixed costs, such as rent and management salaries, as overhead that is not assigned to any particular product or service.
Dispersion: data spread around the mean, measured in range, variance, and standard deviation.
DMADV – Define-Measure-Analyze-Design-Verify: data-driven Six Sigma process to design reliable products and software code.
DMAIC – Define-Measure-Analyze-Improve-Control: data-driven improvement process used in Six Sigma. For more details, download the Lean Six Sigma Lexicon – it’s free!
DMEDI – Define-Measure-Explore-Develop-Implement: see DFSS.
DOE – Design Of Experiment: structured approach of controlled tests to determine the relationship between input factors (conditions = X) and result variable (output = Y). See also Lean6 toolkit.
DPMO – Defects Per Million Opportunities: calculated by the average defects per unit divided by the number of opportunities, normalized to one million. Unit is Parts Per Million PPM. See also Opportunity. DPMU = DPU * 1,000,000.
DPO – Defects Per Opportunity: total defectives divided by total opportunities. Example: 8 of 100 units fail, while each unit consists of 5 parts. As each part is an opportunity to fail, DPO = 8/100*5 = 0.016 = 1.6%.
DPU – Defects Per Unit: number of defects divided by the total number of units tested. DPU = defectives / population. DPUs from sequential nodes can simply be added DPU_total = DPU(test1) + DPU(test2) + DPU(test3). Example A: 100 tested = 90 pass + 10 fail for rework; 10 retested = 6 pass + 4 fail for rework; 4 retested = 2 pass + 2 fail for scrap. Total: 113 tested = 98 pass + 2 scrap. Rolled Throughput Yield RTY = 98/113 = 0.87 = 87%. DPU = 0.13 = 13%. Example-B: 100 produced = 80 pass + 20 scrap; 80 inspected = 70 pass + 10 rejected for rework; 10 inspected = 5 pass + 5 rejected for scrap. Total: 190 tested = 75 pass + 25 scrap. Rolled Throughput Yield RTY = 75/190 = 0.39 = 39%. DPU = 0.61 = 61%.
DRA – Design Risk Assessment: systematic approach to evaluate risks and reliability relative to requirements: (1) External: Critical To Customer CTC, the risk from failing to meet customer needs using FMEA; (2) Internal: Critical To Quality CTQ, the risk in concept and design to meet quality and manufacturability using DFMEA.
Drift: shift in performance or degradation in quality, caused by temperature, strain, or aging. Mathematically, there is a 1.5 Sigma difference between short- and long-term variability to account for drift.
DSI – Days of sales in inventory: calculated 365 days per year / inventory turns. See also Inventory Turns.
E
ECO – Engineering Change Order: revision of a technical design or process to solve a problem or improve performance.
ECR – Engineering Change Request: suggestion or request to improve a technical design or process.
Effect: impact of an input factor (X) on a response variable (Y).
Effectiveness: ability to produce a strong impact, impression, or response. Effectiveness essentially means “doing the right things”; it refers to the degree to which objectives are achieved, calculated by the actual output over the standard output. See also Efficiency and Productivity.
Efficacy: ability to cause an effect.
Efficiency: relationship between outputs and inputs. Reducing waste to consume fewer resources in the conversion process increases efficiency. See also OEE and Effectiveness. See also Lean Audit.
Elemental Time: the time allocated for a task specified in standard work. See also Standard Operating Procedure SOP.
EMEA – Error Mode Effects Analysis: tool to rank and prioritize potential causes of failures to determine the accuracy of a process and develop preventative actions.
Empirical Rule: defined properties of a normal, bell-shaped distribution where 68% values are within 1 standard deviation, 95% values are within 2 standard deviations, and 99.7% values are within 3 standard deviations around the mean.
Entitlement: reference value to which a system can be improved without any capital investment; making it “as good as it can be”.
Entry Criteria: control conditions that must be fulfilled to ensure that a process only receives valid data. See also Exit Criteria.
Ergonomics: the study of motion required to perform a task. Good ergonomics reduces motion waste. By placing parts, procedures, tools and terminals close to the point-of-use. See also Motion Waste.
ERP – Enterprise Resource Planning: system to manage transactions and data-driven processes. Example: process from order entry to delivery that considers materials, production, human resources, machine hours, product development, logistics etc.
Error: an incorrect action, incorrect interpretation of information, or variation in observations or variation that cannot be assigned to controlled variables: Type-I: alpha error or producer’s risk, when a good part is wrongly rejected. Type-II: beta error or consumer’s risk, when a bad part is wrongly accepted.
Error Cause Removal: a 14 step-methodology by Philip B. Crosby to improve quality by reducing errors.
Error Proofing: see Poka Yoke.
ESC – Executive Steering Committee: senior management team leading the implementation of a change-program.
ETT – Express Train Time: cumulative cycle times to determine theoretical lead time; the ETT is the basis for calculating value-add VA.
EWMA – Exponentially Weighted Moving Average: method used in a control chart to detect small process shifts.
Exit Criteria: conditions that must be fulfilled to ensure that a process is stable and performs at an acceptable level. See also Entry Criteria.
External Setup: part of the preparation or changeover process performed outside a machine, while the machine is still in operation. External setup reduces significantly setup-times, as it does not impact machine capacity or uptime. See also Single Minute Exchange of Dies SMED.
F
F-Test: to test if two samples from different populations have the same standard deviation. See also Lean6 toolkit.
Factor: independent variable (X) that influences the response variable (Y).
Failure Mode & Effect Analysis: see FMEA.
FAST – Function Analysis System Technique: method used for value analysis and reengineering.
FIFO – First In First Out: method of inventory rotation or management that ensures that the oldest item (first in) is consumed next (first out).
FISH – First In Still Here: aging inventory caused by poor inventory control, when FIFO is not working.
Fishbone: diagram used for problem solving to organize causes and ideas, also called Ishikawa Diagram. See also Cause & Effect Diagram. See also Lean6 and Translean toolkits.
Fitted Value: response or output variable (Y) predicted by a regression calculation.
FMEA – Failure Mode and Effect Analysis: tool to identify possible failure modes and develop preventative measures: (1) Identify potential failure modes of a product, process, or system; (2) Rank frequency of occurrence, severity and ability to detect the failure; (3) Calculate risk as Risk Priority Number RPN; (4) Develop preventative actions based on the RPN assessment. See also Lean6 toolkit.
Focus-PDCA: improvement process based on Plan-Do-Check-Act by W. Edwards Deming: (F) Find a process to improve; (O) Organize an effort to work on improvement; (C) Clarify current knowledge of the process; (U) Understand process variation and capability; (S) Select a strategy for continued improvement.
Force Field Analysis: identifies driving and restraining forces or factors to solve a problem by strengthening positive force and reducing or reversing negative forces.
FPY – First Pass Yield: rate of good parts that pass first time without rework. FPY is used to track quality throughout the process. FPY just measures input versus output of a process, considering scrap and shrinkage but not the rework within the process. YieldProcess1 = 90%. YieldProcess2 = 80%. YieldProcess3 = 95%. FPY total process = 0.90 x 0.80 x 0.95 = 0.68 = 68% of units pass without a defect. See also Rolled Throughput Yield RTY.
Fractional Factorial DOE: structured Design Of Experiment DOE that allows reducing the number of factors (X) with the trade-off that some factors cannot be evaluated independently; higher-order interactions are confounded with main effects or lower-order interaction. This type of DOE is used when more than five factors are assessed to get quicker to a result, but at lower precision.
FTY – First Time Yield: probability to get a defect-free output from a process; it is most common way to calculate process yield but does not consider rework within the process. Better use First Pass Yield FPY or Rolled Throughput Yield RTY.
Frequency Plot: graphical representation of how often a value occurs. See also Lean6 toolkit.
Full Factorial DOE: structured Design Of Experiment DOE that measures the response (Y) of every possible combination of factors (X) and factor levels (+/-). It allows assessing the main effect and all interactions. The Full Factorial DOE is practically used for up to five factors. See also Lean6 toolkit.
G
GR&R – Gauge Repeatability & Reproducibility: tool to determine variation caused by the measurement system, used to distinguish between process and system variation. A good measurement system has at least 10x less variation than the process it assesses. See also Lean6 toolkit.
Gantt Chart: visual tool to manage project-schedules by task, duration and completion%.
Gating: minimizing opportunities for deviating from a proven process to minimize human error.
Gemba: Japanese term for workplace, the place where value is created day-by-day.
GRPI: model use in the Process Acceleration Process CAP to gauge factors that are critical to team development: (G) Goals, (R) Roles and responsibilities, (P) Process and procedures; (I) Interpersonal relationships.
Goal: targeted result or parameter of a process or product defined by the customer.
Green Belt: quality-improver who is trained by a Black Belt in Lean Six Sigma tools and techniques.
H
Hanedashi: Japanese term for automatic unloading. Example: machine ejects a part after processing to a slide that is attached to a container; the setup does not require an operator to stand-by to unload the machine.
Hard Savings: tangible result when reducing waste or variability of a process; reduction in resource consumption.
Hawthorn Effect: describes that workers perform better when being observed and measured.
Heijunka: Japanese term for load leveling, spreading the production volume as evenly as possible. Heijunka requires reliable machines, adequate skills, and a stable supply of quality parts. See also Translean toolkit.
Histogram: distribution diagram where the length of each bar is proportional to the frequency, how often a value is observed.
Horizontalization: reorganizing traditionally structured companies from departmental silos into value streams, organized around processes.
Hoshin Kanri: Japanese term for annual strategic planning and policy deployment process: Ho=method + Shin=compass. It assesses the strategic objectives against daily management tasks and ensures that all employees understand the strategy and works towards a common goal. Complements the daily planning process Nichijo Kanri. See also Translean toolkit.
House of Quality: assessment tool to rank and correlate existing capabilities against competitors’ and actual customer needs. See also Quality Function Deployment (QFD) process. See also Translean toolkit.
Hypothesis Testing: statistical analysis process to determine if the difference between two samples is due to chance or random (Ho = null hypothesis) or due to true differences (Ha = alternate hypothesis). For more details, download the Lean Six Sigma Lexicon – it’s free!
I
IDOV – Identify-Design-Optimize-Validate: process used in Design For Six Sigma (DFSS) to optimize the design of a product or process: (1) Identify customer needs, specifications and expectations, voice of the customer VOC; (2) Design to translate VOC into critical to customer CTC design attributes and define details; (3) Optimize to reduce variability, design to manufacture DFM and Six Sigma quality level; (4) Validate, measure, assess performance repeatability and reproducible.
Includes/Excludes: tool to define boundaries within a scope of work, used in project charters and job profiles.
IQC – Incoming Quality Control: validation if the quality level of incoming items (parts and information) complies with the standard.
In Control: process free of special causes variation, any signal beyond random variation (noise).
Indirect Cost: cannot be directly assigned to a single product, unit or activity. Examples: executive salaries.
Interaction: response from one factor is influenced by another factor; lines on the interaction plot are not parallel indicating that there is an interaction.
Interaction Data: recorded decision, version of a procedure, test data, time stamp.
Internal Setup: preparing a machine while the machine is stopped. The internal setup time should be moved to external setup whenever possible to minimize capacity losses due to downtime.
Interrelationship Diagram: tool to identify cause-and-effect relationship in complex and multivariable settings.
Inventory: stock for raw materials (R/M), work-in-process (WIP) and finished goods (F/G) waiting to be sold. Traditional batch mentality with MRP-driven planning systems is the main cause for overproduction that ends up in inventories. For inventory assessment, see also Lean Audit.
Inventory Turns: cost of goods sold / average inventory during past 365 days.
IPO – Input-Process-Output: tool consisting of 3 boxes to visually map the process as basis for improvement.
IQR – Intra Quartile Range: distance or difference between the 25and 75 percentile, the 25%-group and 75% group.
Ishikawa Diagram: tool for problem solving developed by the Japanese quality expert Ichiro Ishikawa; it is also called Fishbone Diagram or Cause-&-Effect Diagram. See also Lean6.
ISO9000/QS-9000: body of standards developed in Europe to define minimum requirements for basic business practice and to judge the adequacy of a quality control system. Revised in the year 2000 (ISO 9000:2000) to improve effectiveness of the Quality Management System QMS by focusing more on satisfying customer needs than internal procedures.
IT – Information Management: covers the entire lifecycle of electronic files and paper documents including acquiring, organizing, retrieving, securing, and maintaining information from one or more sources and distributing that information to one or more audiences. The goal of information management is to provide relevant and accurate information on demand, when needed, and where needed. Losses occur when information is irrelevant, inaccurate, missing, or excessively precise, the four types of waste in information management.
J
Jack in the box: variable (X) appearing at random intervals due to non-apparent external factors. Example: manipulation to distort a survey.
Jidoka: Japanese term for “autonomation” or “automation with human intelligence”; it refers to machines being capable to detect errors and automatically stop reproducing them. Jidoka is one of the pillars of the Toyota Production System (TPS).
JIT – Just In Time: making and delivering exactly what is needed, when it is needed, at the exact amount.
Job Costing: method that accumulates overhead costs in cost pools, and then spreads these costs to jobs according to an allocation key. The key is based on standard rates, which are based on historical information.
K
Kaikaku: Japanese term for radical change, a process that breaks the system down into core elements and recreating a new one. Goal is step-improvement. Kaikaku is used when continuous improvement (Kaizen) reached a limit.
Kaizen: Japanese term for incremental improvement, an evolutionary process to continuously improve the existing system. Kaizen literally means change (Kai-) to the better (-Zen). See also Translean toolkit.
Kaizen Blitz: highly focused 1-day to 5-day event led by a small team to attack waste in a product or process with the goal to improve quality or productivity.
Kaizen Process: structured method to create and implement improvements: (1) Get all stakeholder on one table, such as owners, managers, operators, and support people; (2) Define the existing process, using value-stream-mapping, flow charting, SIPOC maps; (3) Design the future process, brainstorm ideas, organize and expand on best ideas, then funnel and conclude; (4) Implement, develop the detailed process, create standard procedures, get buy-in and transfer ownership.
Kanban: visual signal, such as a card, billboard, empty container, a device that triggers replenishment. A Kanban is used to achieve Pull in a JIT system. See also Translean toolkit.
Kano Analysis: tool to prioritize specification parameters based on their impact on customer satisfaction: (1) Must-have: absolute needs that the product must have to be sold; (2) Should-have: items important to the customer; (3) Nice-to-have: items that surprises and delights the customer, “wow”-effect. (4) Must-not-have: items that dissatisfy the customer and cause rejection.
Kappa: measures correctness of judgment (level of agreement to a known standard) by comparing the number of agreement to the number of correct items: 0.0 = no agreement; 0.7 = minimum requirement for the rating-process to be acceptable; 0.9 = good system, 9 out of 10 people will judge the same way. 1.0 = total agreement.
KISS – Keep It Simple Specific: applied simple language to avoid misunderstanding (waste) and improve effectiveness of processes and procedures.
KPI – Key Performance Indicator or Key Process Indicator: metric to evaluate and track outcomes or result data. Example: profit, units shipped, rework%, delay-days, defect rate, quality level, yield, fulfillment rate, customer complaints etc.
KPIV – Key Process Input Variable: self-explanatory.
KPOV – Key Process Output Variable: self-explanatory.
Kurtosis: a measure of flatness of a distribution relative to the normal distribution: (+) elevated, (-) flattened.
L
LCL – Lower Control Limit: defined as 3 Sigma below the mean or average. See also UCL. See also Lean6 toolkit.
Lead Time: the time between order and shipment to replenish an item, defined by the supplier.
Leadership: process of using social influence to maximize the efforts of others towards achieving of a goal; it involves making strategic decisions, organizing a group of people, and inspiring them to perform.
Lean6: collection of Six Sigma tools offered by Leanmap to systematically reduce variability and defect rate in manufacturing and service processes. See also Lean6 toolkit for download.
Lean Layout: arrangement of assets that minimizes losses: (1) safety and human wellbeing through the reduction of motion; (2) productivity through the reduction of internal transportation; (3) flow through connection and synchronization of workstations; (4) visual management through an open layout and a high level of transparency.
Lean Purpose: correctly specify the value that the customer seeks in order to cost effectively and solve customer problems so the organization can prosper.
Lean Process: to be considered “Lean”, each step of a process must meet five checkpoints: (1) Valuable: customer is willing to pay for the step as it creates value and would object if the step was deleted; (2) Capable: Producing a good result every time; (3) Available: Being able to operate whenever needed; (4) Adequate: Having the capacity to keep production in continuous flow; (5) Flexible: Permitting a range of products within a product family to move through a process without batching and delays.
Lean Transformation: five-step process by Womack and Jones to guide managers through a lean transformation. For more details, download the Lean Six Sigma Lexicon – it’s free!
Leveled Production: production schedule in balance with demand; producing at the rate of customer demand (Takt). See also Translean toolkit
Levels: different settings that a factor can be set to: high-low, cold-hot, small-medium-high etc.
LIFO – Last In First Out: bad method of inventory management where the newest unit is consumed first.
Likert Scale: rating tool to measure the strength of an agreement. Example: 5 = strongly agree; 4 = somewhat agree; 3 = indifferent; 2 = somewhat disagree; 1 = strongly disagree.
Little’s Law: equation to assess lead-time relative to inventory and process: Lead-Time [days] = WIP or WAIT [quantity] / average completion rate [units/day]. Example: 100 units in queue with a machine that runs 200 units per day, the lead time is 0.5 day.
LLB – Lean Level of Buffering: smallest buffer size to ensure that capacity meets demand: Cycle Time = Takt Time.
Lot: batch or group of units from one common source with common characteristics.
LSL – Lower Specification Limit: value specifying the minimal level of performance to be acceptable. See also USL.
LTPD – Lot Tolerance Percent Defective: unacceptable level of incoming quality, appropriate to reject the lot. LTPD is also called Reject Quality Level RQL opposed to Acceptance Quality Level AQL.
Lurking Variable: unknown or uncontrolled variable that influences the result of an experiment.
M
Machine Automation Time: machine run time to produce one unit without load and unload.
Machine Capability Index (Cmk): capability index to measure uninterrupted machine run.
Machine Cycle Time: the machine time to produce one unit including load and unload. See also Translean toolkit.
Macro Process: group of several micro processes such as engineering change order ECO approval, product assembly etc.
Main Effect: average output change when a factor (X) is varied from high to low level.
Malcom Baldrige National Quality Award: awarded by the National Institute of Standards and Technology NIST and administered by the American Society for Quality ASQ based on seven criteria: (1) Strategic Planning; (2) Leadership; (3) Market and Customer Focus; (4) Data Analysis; (5) Human Resources; (6) Process Management; (7) Business Results.
Management: job content for a manager. For more details, download the Lean Six Sigma Lexicon – it’s free!
Master Black Belt: Lean Six Sigma expert responsible for strategic planning, leading implementations, and coaching Black Belts and Green Belts.
Mega Process: top-level process covering an entire function, such as commercial, engineering, production etc.
Mentor: highly skilled professional who coaches people with lower skills. Coaching refers to help people attaining their personal goals, which is not the same as training.
Metric: information about a specific parameter used for performance management: throughput, yield, lead-time, etc. The 10 criteria for an effective metric are: (1) actionable, (2) relevant, (3) proximate, (4) accurate, (5) proportional, (6) responsive, (7) causal, (8) simple, (9) meaningful, (10) valuable. See also KPI. To assess the metric dimension, see also Lean Audit.
Micro Process: part of a macro process, several steps performed by the same operator.
MIFA – Material and Information Flow Analysis: see Value Stream Mapping (VSM). See also Translean toolkit.
Motion: movement of the body, arms, legs, or fingers.
Motion Waste: movement that does not add value: (1) Mega waste from poor plant layout and excessive walking; (2) Macro waste from poor methods or suboptimal processing; (3) Micro waste from bending, stretching, and reaching; (4) Nano waste from hand and finger motions; gets and grasps.
Muda: Japanese term for waste, any activity or feature that the customer is not willing to pay for or does not enable the next process. Waste is adding cost without providing value to the customer or next process. See also Translean toolkit.
Mura: Japanese term for variability; inconsistent quantity, quality, cost or delivery. Heijunka and Six Sigma focuses on reducing Mura.
Muri: Japanese term for strain or stress; difficulties that arise when demand exceeds capacity or capability.
N
Nagara System: doing two or more tasks at the same time in one sweep or motion; requires an ergonomic design.
Nichijo Kanri: the short-term, daily planning and management process: Nichijo=daily and Kanri=Management. Nichijo Kanri complements the annual planning process Hoshin Kanri.
Normal Tolerance: natural control limits at +3 and -3 standard deviations (Sigma levels) from the mean or process average.
Noise: random or common cause variation from a non-controllable process variable.
Nominal: target values (Y) for critical to quality CTQ parameters, translated from customer needs, the critical to customer CTC attributes.
Nominal Data: categorical data (labeled), such as nationality, gender, religion, education level etc.
Nominal Group Technique: tool to resolve conflicts between teams to get consensus on priorities, approaches, solutions, and next steps by individual ranking of importance to get to overall priorities.
Non-Conformance: defect caused by deviation from the established standard or requirement.
Non-Conformity: failing to meet specified and expected requirements.
Non-Parametric Test: used instead a parametric test when normality of the sample population is questionable.
Non-Value Add: any feature or activity that adds cost but no value, such as waste and incidental work, unnecessary and necessary waste, or Muda-1 and Muda-2.
Non-Performance Cost – NPC: tangible losses caused by shrinkage, rework, repairs, returns, penalties, lost hours, and scrap. Cost of poor quality (COPQ) additionally accounts for non-tangible costs that include lost orders, missed discounts, decrease in goodwill, and lower brand image or value. See also Lean6 and Translean toolkits, and Lean Audit.
Normal Distribution: ideal spread of information, bell-shaped “Gaussian” curve, perfectly mirror symmetric, peak in the middle. In an ideal case, the peak is identical to mean, median, mode of the data. See also Lean6 toolkit.
Normal Probability: determine if observations follow a normal distribution; the distribution is normal when p >0.05.
Non-Quality Cost – NQC: see Cost Of Poor Quality COPQ.
Null Hypothesis (Ho): stated assumption that there is no difference between populations based on sample mean, spread, and variance. According to Ho, any observed difference is due to chance or sampling error. See also Lean6 toolkit.
O
O’Brien Effect: making suggestions to a customer without truly knowing what the customer needs (creating waste), motivated by primal urges to talk, resulting in Speaking Without Thinking of the Consequences (SWTC), also called “speaking bollocks” in UK.
OCT – Operator Cycle Time: time it takes for a worker to complete a set of tasks including loading and unloading before the works repeats; OCT is measured without time spent for waiting.
OEE – Overall Equipment Efficiency or Overall Equipment Effectiveness: measure of machine efficiency based on three factors: (1) Availability = time available for work/ time scheduled; (2) Speed = actual rate of production / capacity of machine per engineering specification; (3) Quality = Yield = good parts / total number of parts processed. For assessing OEE, see Lean Audit.
OEM – Original Equipment Manufacturer: term used when one company makes a part or subsystem that is used by another company’s end product.
Objective Evidence: compelling proof that a change was effective to deliver expected results, a procedure was followed, an audit was performed, or a requirement was met.
One-Piece Flow: achieving flow by reducing batch sizes to single units (or mini batches) without inventory or batches in between; it allows detecting defects immediately, preventing reproducing defects in large batches. See also Translean toolkit.
OPE – Overall Performance Efficiency: metric to determine the overall performance of a machine, work center, or plant by the cumulative impact of five factors, calculated in wasted time / total cycle-time: (1) Scheduling waste; (2) Waste of motion; (3) Waste of wait; (5) Other wastes specific to the operation, such as setup; (5) Performance loss between average and top performer.
Operations Costs: running cost, the maximum expenditure on material, labor, overhead, utilities, services etc.
Operations Process: leveraging on the economies of scale by creating a repetitive product or service in a controlled, mass-production environment.
Opportunity: related to measuring defect rate in Defects Per Million Opportunities DPMO in value-generating operation steps. Definition by Motorola: Opportunity = number of parts + number of connections. Definition by Allied Signal: Opportunity = 3x number of parts per Bill Of Materials BOM.
Optimization: adjusting a process, skill or system to create the maximal response at minimal variability.
Organization Structure: designing an effective organizational structure requires four elements: for more details, download the Lean Six Sigma Lexicon – it’s free!
OSHA – Occupational Safety and Health Administration: the regulatory body specifying health standards in the US.
Outlier: data point located outside from the specified and expected range of data.
Output: outcome, result of a process (Y).
Ownership: having the right and responsibility to act and make decisions – and being accountable for those actions.
P
P-Value: probability of a statistical hypothesis test to be lower, equal, or higher than observed by chance.
Pacemaker: element of the value chain or process that synchronizes work to the pace of demand. See also Takt-Time.
Paired t-Test: two-sample t-test is used to determine if two population means are equal. Paired t-test: the same item is measured before and after the change. Unpaired t-test: items and sample-sizes may be different.
Pareto: principle that states that 80% results (Y) are caused by 20% inputs (X) or 80% of problems are caused by 20% causes.
PDCA – Pan-Do-Check-Act: (1) Plan for change: analyze and predict results; (2) Do: execute the plan in small steps under controlled condition; (3) Check or Study: evaluate and validate the results, if it went the right direction; (4) Act: take action, standardize the improved process or correct the assumptions and start another cycle. See also Translean toolkit.
PFMEA – Process Failure Modes Effects Analysis: see FMEA with focus on processes.
Poka Yoke: Japanese term for error proofing (Poka=error + Yokeru=avoid) achieved through fail save, checklists, key-lock systems to reduce or eliminate the probability of defects.
Point Kaizen: improvement technique focused on a single workstation, involving workers from in-station, upstream and downstream processes.
Poisson Distribution: discrete distribution (X = 0, 1, 2, 3…) used for counts, number of events. See also Lean6 toolkit.
Policy Deployment: strategy deployment process based on the Deming cycle PDCA to (1) develop shared goals, (2) communicate and cascade those goals, (3) involve people in planning, (4) hold participants accountable for their role in the plan, and (5) drive focus down into the organization to meet critical objectives. See also PDCA and Hoshin Kanri. See also Translean toolkit.
Population: entire group from which the sample is taken; example: Catholics in Europe.
PQC – Poor Quality Cost: see Cost of Poor Quality COPQ.
Preventive Action: reduces the reoccurrence rate of a potential nonconformance.
Preventive Maintenance: partial or complete overhauls at specified intervals reduce the risk of failure and performance degradation of equipment. It preserves and restores equipment reliability by replacing worn components before they actually fail.
Process Capability Maturity Model – PCMM: qualitative approach to evaluate process maturity in five stages: (1) unstable, (2) repeatable, (3) defined, (4) managed, (5) optimizing. For process assessment, see also Lean Audit.
Process Capacity Table: chart to specify machine load to available capacity.
Process Costing: companies making a homogenous product, such as juice or cement, use process costing to spreading overhead cost across various processing departments. For more details, download the Lean Six Sigma Lexicon – it’s free!
Processing Sequence: order in which an item (part or transaction) is processed.
Production Smoothing: scheduling method to reduce demand fluctuations by producing every part every day EPED.
Productivity: the actual output over the actual input, such as the number of units made per employee or direct labor minutes per unit DLMPU, and influenced by efficiency and effectiveness.
Pull System: replenishment is triggered by consumption, where a part is only produced when taken away by a customer to fill the empty slot again.
Push System: when resources are allocated based on forecasts and schedules, regardless of actual demand. Push creates massive problems through overproduction and inventory. See also Material Resource Planning MRP.
Q
QA – Quality Assurance: managerial process and system to fulfill customer specifications and expectations by (1) Identifying non-conformance; (2) Assessing sources and causes of variation; (3) Defining actions to eliminate root-causes.
QC – Quality Control: managerial process defined by Juran: (1) Choose control parameters, what to control; (2) Define unit of measure; (3) Establish standards of performance; (4) Create methods of measurement; (5) Measure performance; (6) Interpret the results, actual versus standard; (7) Take action on the difference.
QFD – Quality Function Deployment: structured tool and methodology to identify and quantify customer needs, the Voice Of the Customer VOC, and translate them systematically into design specifications. For more details, download the Lean Six Sigma Lexicon – it’s free!
QI – Quality Improvement: organized, systematic and never-ending activity to improve skills, products, processes, and systems with the ultimate goal of achieving perfection. See also Continuous Improvement CI.
Qualitative Data: see discrete data.
Quality: three common definitions (1) Quality is whatever the customer accepts by meeting requirements specifications and expectations. (2) Quality is value created for society by focusing on real needs (pull) versus perceived needs (push). (3) Quality means creating maximum value, consistently at maximum efficiency by reducing waste and variability. To assess quality, see also Lean Audit.
Quality Attribute: property of a product, process, or system to be important to the end customer. See also Critical To Customer CTC and Critical To Quality CTQ.
Quality Chain Reaction: process defined by Deming: (1) Improve quality; (2) Improve productivity; (3) Decrease cost; (4) Decrease price; (5) Increase market; (6) Stay in business; (7) Provide more jobs.
Quality Control Tools: basic statistical tools that include (1) Pareto chart for prioritization where parameters are sorted by impact, the 80/20 rule; (2) Run chart displays a parameter over time, such as yield or output; (3) Scatter plot shows the relationship between two parameters, such as yield versus temperature; (4) Frequency distribution shows how often each value appears; (5) Statistical process control chart shows capability of a process; (6) Cause and effects diagram or histogram to analyze a problem. See also the Seven Quality Tools 7QT. See also Lean6 toolkit.
Quality Function Deployment: see QFD.
Quality Improvement: see QI.
QIP – Quality Improvement Process by Crosby: for more details, download the Lean Six Sigma Lexicon – it’s free!
Quality Management: set of activities to achieve minimal waste and variability, QA + QC + QI.
Quality Planning by Juran: for more details, download the Lean Six Sigma Lexicon – it’s free!
QS9000: US-automotive equivalent of the European ISO9000, being replaced by ISO/TS 16949.
Quality Target: each activity impacting final quality is assigned a target limit, a maximum defect or non-conformance rate, measured in DPMO.
Quantifiers: means to measure and track performance: (a) Result Quantifier, such as Rolled Throughput Yield RTY or Earnings Before Income Taxes EMIT; (b) Process Quantifiers, such as yield by work cell, Overall Equipment Efficiency OEE or Overall Process Efficiency OPE.
Quantitative Data: all values are possible, see also Continuous Data.
Quantitative Variable: characteristic that can be counted; a numerical measurement.
Quick Response: the ability to respond quickly to change in volume, mix and customer taste, while maintaining standards without compromising on quality for additional volume.
Queue Time: the time an item is waiting to be processed.
R
r: see Correlation Coefficient.
R-Squared: coefficient of determination that measures how close data are to the fitted regression line; it describes the degree of variation (dY) caused by an input (X). 0%/100% indicates that the model explains none/all of the variability of the response data around the mean. See also Regression and Correlation.
Radian: unit of angular measurement “rad” = 2 pi rad in the circumference of a circle, pi = 3.14159x.
Radical Redesign: innovation process to achieve step-change in performance. See also Kaikaku.
Random Sample: data taken at random from the population.
Random Variation: tendency of an estimate based on a sample average to be off the true population value. The larger the sample size, the lower random variation and the higher the precision of the estimated value.
Randomization: activities in random order to reduce the effect of uncontrolled factors.
Range: interval between the smallest or lowest and largest or highest value.
Rational Subgroup: subgroup of data to identify and separate special cause variation (non-random variation) in between subgroups.
RBI – Risk Based Inspection: inspection depth and interval according to calculated risk levels based on the Risk Priority Number RPN.
RBM – Risk-Based Maintenance: maintenance depth and interval according to calculated risk levels based on the Risk Priority Number RPN.
RCI – Root Cause Investigation: see Root Cause Analysis.
Regression: statistical analysis tool to quantify the relationship between variables (Y) and (X) by fitting a line or plane through all points. See Scatter Plot. See also Lean6 toolkit.
Reliability: probability of a product or process to perform adequately its specified purpose under specified conditions for a specific period of time. See Life Cycle.
Repetition: repeating an experiment to reduce variation between measurements of the same item under the same conditions to improve repeatability.
Repeatability: variation in average measurements when measuring the same item several times under the same conditions.
Replication: repeating an experiment to increase reproducibility; common are three to five replications.
Reproducibility: variation in average measurements when a part is measured by different operators or on different equipment under the same conditions using the same technique. See also Lean6 toolkit.
Residual: residual error, the difference between the actual and predicted output value (Y) by the regression equation.
Resolution: the accuracy or degree of which a factor can be discriminated or identified denoted with Roman numerals (I, II, III, IV…): (a) GR&R Gauge Repeatability and Reproducibility: number of distinct categories; (b) DOE Design of Experiment: confounding among effects.
Response: reaction or output (Y) to a specific stimulus or input (X).
Responsibility: capacity to be conditionally liability, assuming adequate expertise and capability.
Rework: additional work to rectify defects, see also Waste and 8W.
Risk-Based Maintenance – RBM: periodic tests and analysis together with preventive maintenance to understand health conditions and breakdown risks to determine the appropriate maintenance program.
Risk Priority Number – RPN: quantified risk in a Failure Mode and Effect Analysis FMEA.
Robust: insensitivity to input variations (dX) that does not affect results (Y).
Robust Process: resistant to defects, operating at a high Sigma-level.
RONA – Return on Net Assets: calculating financial effectiveness of a business by relating resources to return: RONA = Net Income / (Fixed Assets + Net Working Capital).
Root Cause: origin of an event, the identified reason for non-conformance, such as defect, delay, or disconnect.
Root Cause Analysis – RCA: systematic study of the reason of non-conformance with the goal to permanently remove its cause.
RQL – Reject Quality Level: trigger level to reject a lot. See also AQL.
RTY – Rolled Throughput Yield: probability for a single unit to pass through the entire process without defect. RTY considers rework. RTY = (Qin – Qscrap – Qrework) / Qin. Process-A = (90 in – 5 scrap – 2 rework) / 90 in = 85 out at 92% yield; without rework: 85/90 = 95% yield. Process-B = (85 in – 1 scrap – 3 rework) / 85 in = 84 out at 95% yield; without rework: 84/85 = 99% yield; RTY = 0.92 x 0.95 = 87% considering scrap and rework. Compare to First Time Yield FTY = 0.95 x 0.99 = 94%; only considering input, output, scrap. See also Lean6 toolkit.
Run Chart: performance monitored over time to identify a trend or pattern.
S
Sample: portion or subset of units taken from the population used for analysis to estimate the properties of the population.
Sample Size Calculator: tool to calculate the optimal sample size. See also Lean6 toolkit.
Sampling: practice of gathering a subset of all data available.
Saturated Design: Design Of Experiment DOE at resolution III are “saturated”. To analyze interactions between factors, unsaturated designs are more suitable at resolution V+.
Scamper: idea generation and synthesis technique by Michael Michalko: (S) Substitute; (C) Combine; (A) Adapt or adopt; (M) Modify, magnify, minify; (P) Put to other uses; (E) Eliminate; (R) Reverse or rearrange.
Scatter Plot: scatter diagram is a graphical tool that illustrates the relationship between two variables (X) and (Y).
SCM – Supply Chain Management: planning and controlling the sourcing of goods and the movements from raw materials to finished goods with focus on reducing lead-times and inventory levels.
Scope: extent to which a process, project, program, or procedure applies.
Scorecard: see Balanced Scorecard (BSC).
Screening: inspection to discriminate between pass and fail.
Secondary Metric: measures negative side effects as a result of improving the primary metric. Same as Consequential Metric.
Segmentation: dividing into small, logical categories to simplify analysis.
Sensei: Japanese term for master or teacher, “one who has done it before”.
Sensitivity: change of output (dY) relative to changing input (dX).
Service Quality: is based on 10 criteria: (1) Reliability, (2) Responsiveness, (3) Competence, (4) Access, (5) Courtesy, (6) Communication, (7) Credibility, (8) Security, (9) Understanding, (10) Tangibles.
Setup Reduction: shortening the time it takes to prepare a machine or work center between the last unit of batch-A and first unit of batch-B. See also SMED.
Short Interval Leadership: Group Leader (GL) who visits each Team Member(TM) several times a day to check on performance and issues, and to provide feedback, correction and encouragement.
Sigma: the small Greek letter sigma represents standard deviation of a population; it translates specification limits into Z-values.
Sigma Level: measure of quality based on number of defects in a process. 1 Sigma: 690,000 defects per million opportunities DPMO or 68% values within 1 standard deviation around the mean. 2 Sigma: 308,000 DPMO or 95% quality. 3 Sigma: 66,800 DPMO and 99.7% quality. 4 Sigma: 6,210 DPMO or 99.4% quality. 5 Sigma: 230 DPMO or 99.98% quality. 6 Sigma: 3.4 DPMO or 99.9997% quality. See also Lean6 toolkit.
SIMPL – Successful Initiative Management and Product Launch: model used by P&G Company to control the New Production Introduction NPI process.
SIPOC – Supplier-Input-Process-Output-Customer: model to describe the flow of material and information from end-to-end.
Six Sigma: improvement methodology based on statistics to reduce variability and improve quality to no more than 3.4 Defects Per Million Opportunities DPMO, considering a +/-1.5 Sigma drift around the mean in the long term. See also DMAC and DFSS.
Six Sigma 3S Process: (1) Shift: adjust if the center of the process is outside the specification-limits. (2) Shrink: reduce the spread within specification-limits. (3) Stabilize: add elements to control the process, the standards, limits, and audits.
SMED – Single Minute Exchange of Dies: method to reduce setup-time by (a) moving internal to external setup and (b) reduce setup-waste. SMED was originated from a Japanese contest to change dies of a large press for automotive presses below one minute. The preparation of a machine in less than 10 minutes (single digit minutes) is considered “Rapid Changeover”, while in less than one minute it is true SMED.
Skewness: measurement of asymmetry, when mean and median are different: -3…+3 for left-skewed to right-skewed distributions.
SLA – Stop Line Authority: workers are authorized to stop the line for any deviation from the standard, preventing defects from being reproduced. The halted line triggers immediate response “the problem must be solved, right there, right now”. See also Andon.
SMART: an effective target always meets the five SMART criteria: (S) Specific, simple, significant; (M) Measurable, motivating; (A) Agreed, aligned, achievable, actionable, acceptable; (R) Realistic, relevant, rewarding; (T) Time-bound, tangible, truthful.
SME – Subject Matter Expert: individual who has the most expertise or skill in a specific area.
Soft Benefit: improvement that cannot be translated directly into monetary benefits, such as motivation, goodwill, or image.
SOP – Standard Operating Procedure: procedure outlining all critical elements to perform an operation including all steps performed by a human and machine. See also Translean toolkit.
Span: range without outliers; typically P95-P5, the range between 5th and 95th percentile.
SPC – Statistical Process Control: methods and tools to assess process performance by measuring how well a process meets requirements in accuracy (mean, median, mode) and dispersion (ranges and standard deviations). Purpose is to identify special cause variation (signal beyond noise) at +/- 3 Sigma around the mean (containing 99.7% of all values). See also Lean6 toolkit.
Special Cause Variation: shift in output caused by a non-random (special) event, assignable factor.
Specification: customer-needs translated into parameters that can be tested and validated.
Spread: distance from the mean or center, measured in Standard Deviations. See also Sigma Level.
Stable Process: a process that produces predictable results consistently; an output that is consistent over time without special cause (assignable) variation, where only common cause variation (noise) is present.
Stakeholder: people who affect or who are affected by a change or project.
Standard Deviation: measure of variability in a distribution, the spread of data relative to the mean.
Standard Operations: optimal setup of people and machines consuming minimal resources (labor, space, energy, inventory, equipment) to accomplish work.
Standard Work: predefined steps to get the work done in the most effective way; it covers (a) required tasks, (b) allotted time and rate, (c) responsibilities and accountability for the outcome, (d) expected yield, check points, control limits, and steps to solve problems, handle abnormalities. See also Translean toolkit.
Statistics: process of systematically collecting, organizing, and interpreting numerical data through mathematics.
Strategic Plan: defines the long-term objectives of an organization and required resources; it includes: (1) Mission statement, the “what”; (2) Strategic analysis, the “why”; (3) Strategic formulation, the “where”; (4) Long-term objectives, the “when”; (5) Operational plans, the “how”. See also Hoshin Kanri.
Strategic Planning: making decisions that shape and guide an organization by defining: what must, should, can, and must not be done.
Strategy Deployment: see Policy Deployment and Hoshin Kanri. See also Translean toolkit.
Stratification: technique to divide a population into homogeneous groups (strata).
Sub-Optimization: keeping machines, cells and work-centers running at maximum load in an attempt to be efficient by absorbing a large investment (equipment) by producing many parts regardless if they can be sold or end up in inventory. Local efficiency is typically driven by cost accounting methods, creating a spot optimum while reducing overall efficiency. See also Theory of Constraints TOC.
Supermarket: a store presenting specific items at controlled quantities to be taken away by customers. Consumption triggers replenishment, nothing is refilled before taken away by a customer. In production, a supermarket is used to make demand visible to the cell or work center, triggering production only when parts were consumed.
SWI – Standard Work Instruction: document outlining the sequence of production steps and how to move materials within the work station.
SWIP – Standard Work In Process: minimum inventory required in front of the workstation to be able to complete one cycle of work without delay.
SWOT – Strengths, Weaknesses, Opportunities, Threats: strategic planning tool to analyze an individual, group, organization, or environment.
Systems Engineering: cross-functional approach to determine the life cycle or life expectancy of a product in which it is capable to satisfy customer needs.
Systems Thinking: a holistic approach that analyzes how parts of system interrelate within the context of a larger system; it consists of five elements: (1) Problem structuring, (2) Causal loop modeling, (3) Dynamic modeling, (4) Scenario planning, (5) Implementation and learning.
T
t-Statistics: to determine if two samples are statistically different based on their means, standard deviation and sample size. Comparing the t-value against alpha determines if hypothesis is true or false.
t-Test: statistical tool to determine if a significant difference exists between the means of two distributions or the mean of one distribution and a target value.
Taguchi Method: tool to design and execute experiments to analyze processes where the result variable (Y) is affected by many input variables (X’s) under minimal number of experiments. See Design of Experiment DOE.
TACT – Total Actual Cycle Time: the sum of all manual and machine cycle times to produce one unit of output.
Takt Time: rate of customer demand, available time / number of units required. Example: a coffee shop brews and delivers one coffee every 30 seconds. See also Translean toolkit.
TCT – Total Cycle Time: process cycle time under consideration of setup time. TCT = [CT + setup-time] / batch-size.
Team Leader: see TL.
TEEP – Total Equipment Effectiveness Performance: measures effectiveness of equipment relative to the calendar year; it is also called “Business OEE”. TEEP = valuable operating time / 365 days per year = Utilization x OEE. For a commercial airplane, TEEP = (hours in the air) / (365 x 24 hours).
Throughput: rate of production, output over a specified period of time.
Thulla: wasted time due to lack of motivation, taking extra-long, taking extra breaks etc.
TIM WOODS: see 8W.
Time-Based Strategy: organizing business objectives around economy of time principles.
Time Value Map: tracking work through the process by recording time: (1) Value added; (2) Necessary or type-I waste required by the operating system, (3) Avoidable or type-II waste, such as defects and waiting.
TL – Team Leader: supervisor of a work-cell or work-center responsible for maintaining target-level of quality and productivity.
TOC – Theory Of Constraints or Constraints: management philosophy to optimize the entire system towards maximum productivity. TOC focuses on the strengthening the entire chain rather than individual links, using five tools: (1) Current reality tree; (2) Evaporation cloud; (3) Future reality tree; (4) Prerequisite tree; (5) Transition tree.
Tolerance Range: difference between upper and lower specification limit (USL – LSL).
Tollgate: control element between phases or milestones. Guiding principle is that nothing is passed on without meeting the minimum requirements (degree of completion). Also called Quality Gate by McKinsey.
TPS – Toyota Production System: application of Lean principles as a system based on two pillars, Jidoka and Just In Time (JIT).
TPM – Total Productive Maintenance: process and system to increase uptime by eliminating the reasons for downtime. TPM thinking is based on three principles: (1) Total participation at all levels: operators perform routine maintenance, technicians are responsible for preventive maintenance, and managers optimize the maintenance program to maximize return on investment; (2) The total lifecycle of equipment determines appropriate practices: maintenance activities and frequency are dynamic; schedules and checkpoints are continuously adjusted relative to the age and condition of the equipment; (3) Attaining total productivity by eliminating the main causes of poor equipment performance: the 6 Big Losses. See also 6BL. To assess maintenance effectiveness, see also Lean Audit.
TQM – Total Quality Management: concept of continuous improvement to achieve world-class quality through systematic management of all business processes.
Translean: Lean toolkit offered by Leanmap to reduce waste and cycle times in manufacturing and service processes. Download on www.leanmap.com/tools.
Tree Diagram: method of organizing stratified data.
Trend Chart: visual tool for process control and management; it displays a value over time.
Tribal Knowledge: informal, unrecorded knowledge.
Tsurube System: a way to maintain continuous flow even when processes are disjointed due to outside processing, like heat treatment, plating, anodizing. A Tsurube system is also called “Well Wheel System” because of the similarity to how water is drawn out of a well using two buckets and a pulley wheel.
Type- I Error: producer’s risk, rejecting a good part. See also Alpha Risk.
Type-II Error: consumer’s risk, accepting and shipping a bad unit. See also Beta Risk.
U
UCL – Upper Control Limit: 3 Sigma (3 standard-deviations) above the mean so that 99.7% falls between the upper and lower control limit, UCL and LCL. Note that control limits are not the same as specification limits. See also Lean6 toolkit.
Unit: item of work to process.
Univariate: random variable with a numerical value.
USL – Upper Specification Limit: highest acceptable value per specification.
V
VA – Value-Added: any activity that changes the product or service in a way that the customer is willing to pay for.
For more concepts and tools, download the Lean Six Sigma Lexicon – it’s free.
W
Warning Limits: 2 Sigma Level; limits on a control chart that are set to -2…+2 standard deviations from the process average.
Waste: see 7W, 8W. See also Translean toolkit.
Whisker: displays minimum and maximum observations of a box plot within 1.5 Inter Quartile Range (IQR), the range between the 75th and 25th percentile.
White Noise: random fluctuation over the entire frequency spectrum.
WIP – Work In Process: all items waiting in queue to be processed.
Work Cell: grouping of machines, tools, and operators to maximize flow, quality and productivity.
Work Sequence: defined steps in correct order to achieve a desired result. See Standard Work Instruction SWI and Standard Operating Procedure SOP. See also Translean toolkit.
X
X: an independent variable (input) to a process that affect its output (Y).
X-Matrix: planning tool used for strategy deployment. It aligns the organization with its strategic objectives, resources, and activities; and maps operational targets to functions and processes. See Strategy Deployment and Hoshin Kanri. See also Translean toolkit.
Y
Y: dependent or response variable (Y) to an input variable (X).
Yield: measure of process quality as percentage of defect-free items produced. First Time Yield FTY measures quality as the ratio between output and input without considering rework. Rolled Throughput Yield RTY considers additionally the rework within the work center. Example: 100 units enter a process, 99 are finished to specification, 2 are reworked, and 1 is scrapped, then RTY = (99-2) / 100 = 0.97 = 97% and the overall process yield RTY = (99-1) / 100 = 99%. See also Lean6 toolkit. To assess quality and yield, read more in the Lean Audit book.
Z
Z-Value: universal measure of distance in standard deviations from the mean: Z = (X – Xbar) / Sigma. See also Lean6 toolkit.
Z-Shift: difference between ZST and ZLT set to 1.5 Sigma; it is the drift between short-term and long-term variability.
ZLT: long-term process capability considering +/- 1.5 Sigma shift to account for drift over time or aging.
ZST: short-term process capability right after adjustment.
Zero Defects: ultimate goal to improve a process to achieve perfect quality.